

Data as of June 28, 2026
Market insights by dwelling type · Jul 2024 – Jun 2026 · 109 closed sales
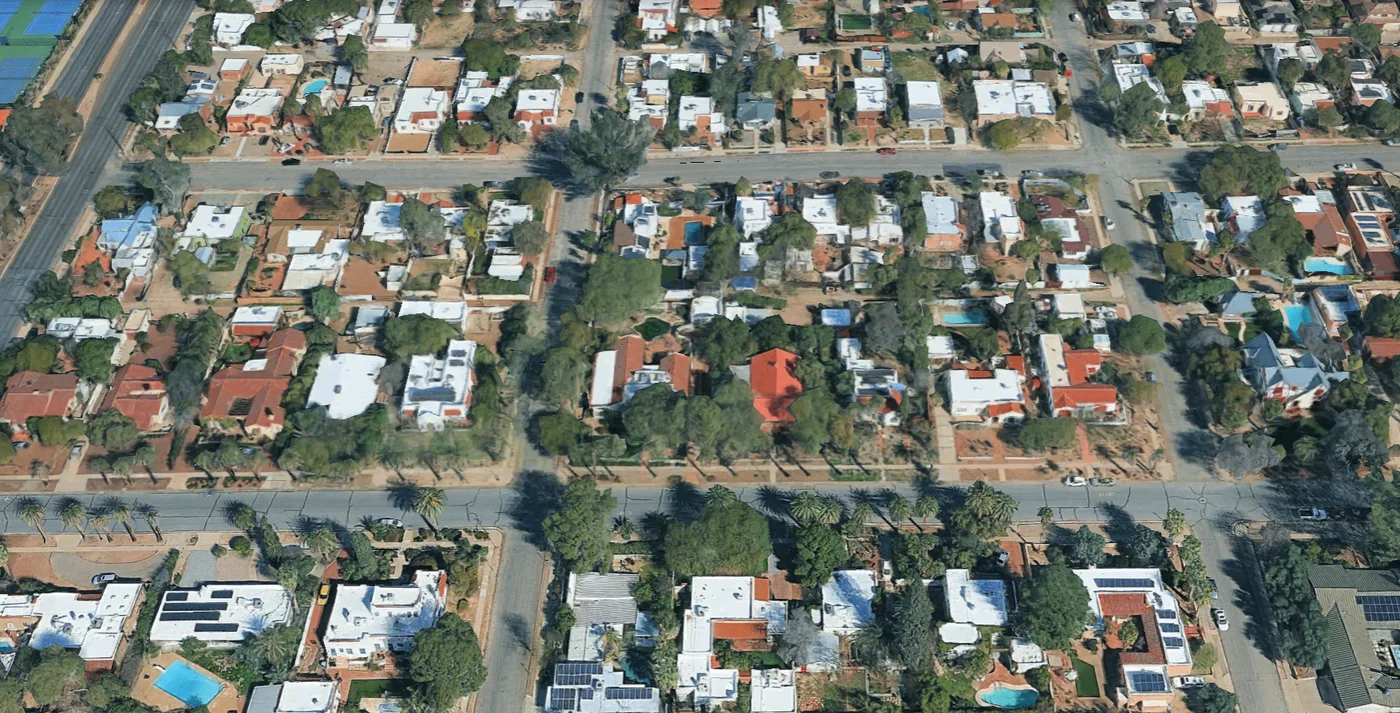
Sam Hughes is one of Tucson's most beloved historic neighborhoods, situated just east of the University of Arizona campus. Developed primarily in the 1930s through 1960s, it is characterized by brick bungalows, ranch homes, and mid-century residences on tree-lined streets. The neighborhood is bounded roughly by Speedway Boulevard to the north, Tucson Boulevard to the east, Broadway Boulevard to the south, and Campbell Avenue to the west. Its walkability, mature landscaping, and proximity to the university, 4th Avenue, and Reid Park make it consistently one of the most sought-after addresses in central Tucson. Many homes carry historic designations, and the Sam Hughes Neighborhood Association is among the city's most active.
| Status | Sqft | List price | DOM |
|---|---|---|---|
| Condo & Townhouse | |||
| Pending | 1,071 | $395,000 | 70 |
| Active | 2,761 | $400,000 | 148 |
| Single Family | |||
| Active | 2,350 | $745,000 | 2 |
| Active | 2,379 | $725,000 | 3 |
| Active | 1,255 | $550,000 | 4 |
| Active | 810 | $345,000 | 11 |
| Active | 1,529 | $699,000 | 12 |
| Pending | 1,483 | $399,900 | 16 |
| Active | 1,804 | $365,000 | 46 |
| Active | 4,676 | $1,775,000 | 55 |
| Active | 3,047 | $675,000 | 80 |
| Active | 3,511 | $949,000 | 88 |
| Active | 2,077 | $585,000 | 130 |
| Active | 1,907 | $619,000 | 135 |
| Active | 1,463 | $499,000 | 136 |
| Active | 1,162 | $549,900 | 239 |
Gray bars indicate the DOM for a previous expired or cancelled listing on the same property.
| Closed | Avg orig list | Avg sold | Sold / orig | Avg DOM | |
|---|---|---|---|---|---|
| <1,500 sqft | 25 | $494k | $477k | 96.5% | 29d |
| 1,500–1,999 sqft | 42 | $672k | $643k | 95.6% | 50d |
| 2,000–2,499 sqft | 11 | $726k | $703k | 96.8% | 27d |
| 2,500+ sqft | 18 | $1.29M | $1.22M | 94.2% | 53d |
Gray bars indicate the DOM for a previous expired or cancelled listing on the same property.
Q3/4 2025 was noticeably slower across the board. Every SFR size bracket saw days on market rise in the second half of 2025 — large homes (2,500+ sqft) averaged 85 days, up from 66 in Q1/2 2025. Several listings that year ran well over 100 days before selling. The Q1/2 2026 data suggests a meaningful recovery is underway, with DOM falling back toward Q3/4 2024 levels in most brackets.
Smaller homes command a premium per square foot. Homes under 1,500 sqft achieved $418/sqft in Q3/4 2024 and $412/sqft in Q1/2 2025 — the highest of any size bracket. These are entry-level prices for a highly desirable neighborhood, and demand from investors, downsizers, and first-time buyers keeps them competitive. Their sold/orig ratio (96.5%) is also the strongest among SFR brackets.
The typical discount off original list is modest — but uneven. The overall SFR sold/orig ratio of 95.7% suggests buyers save about 4% on average. In practice, well-priced homes sold at or above list while stale listings absorbed larger reductions. By month three on market, a listing's negotiating dynamic shifts considerably.
Condos and townhomes have outperformed expectations. With a 100.6% sold/orig ratio and a 24-day average DOM, the CTH segment has been consistently healthy — sellers here have generally priced well and buyers have responded. The sample of 13 sales is too small for strong conclusions, but there's no sign of softness.